Integrated archaeological analysis
Your data doesn't stop at recording. Excavata carries the same structured excavation record straight into serious analysis — no exporting into a pile of disconnected tools.
One environment, from context sheet to interpretation
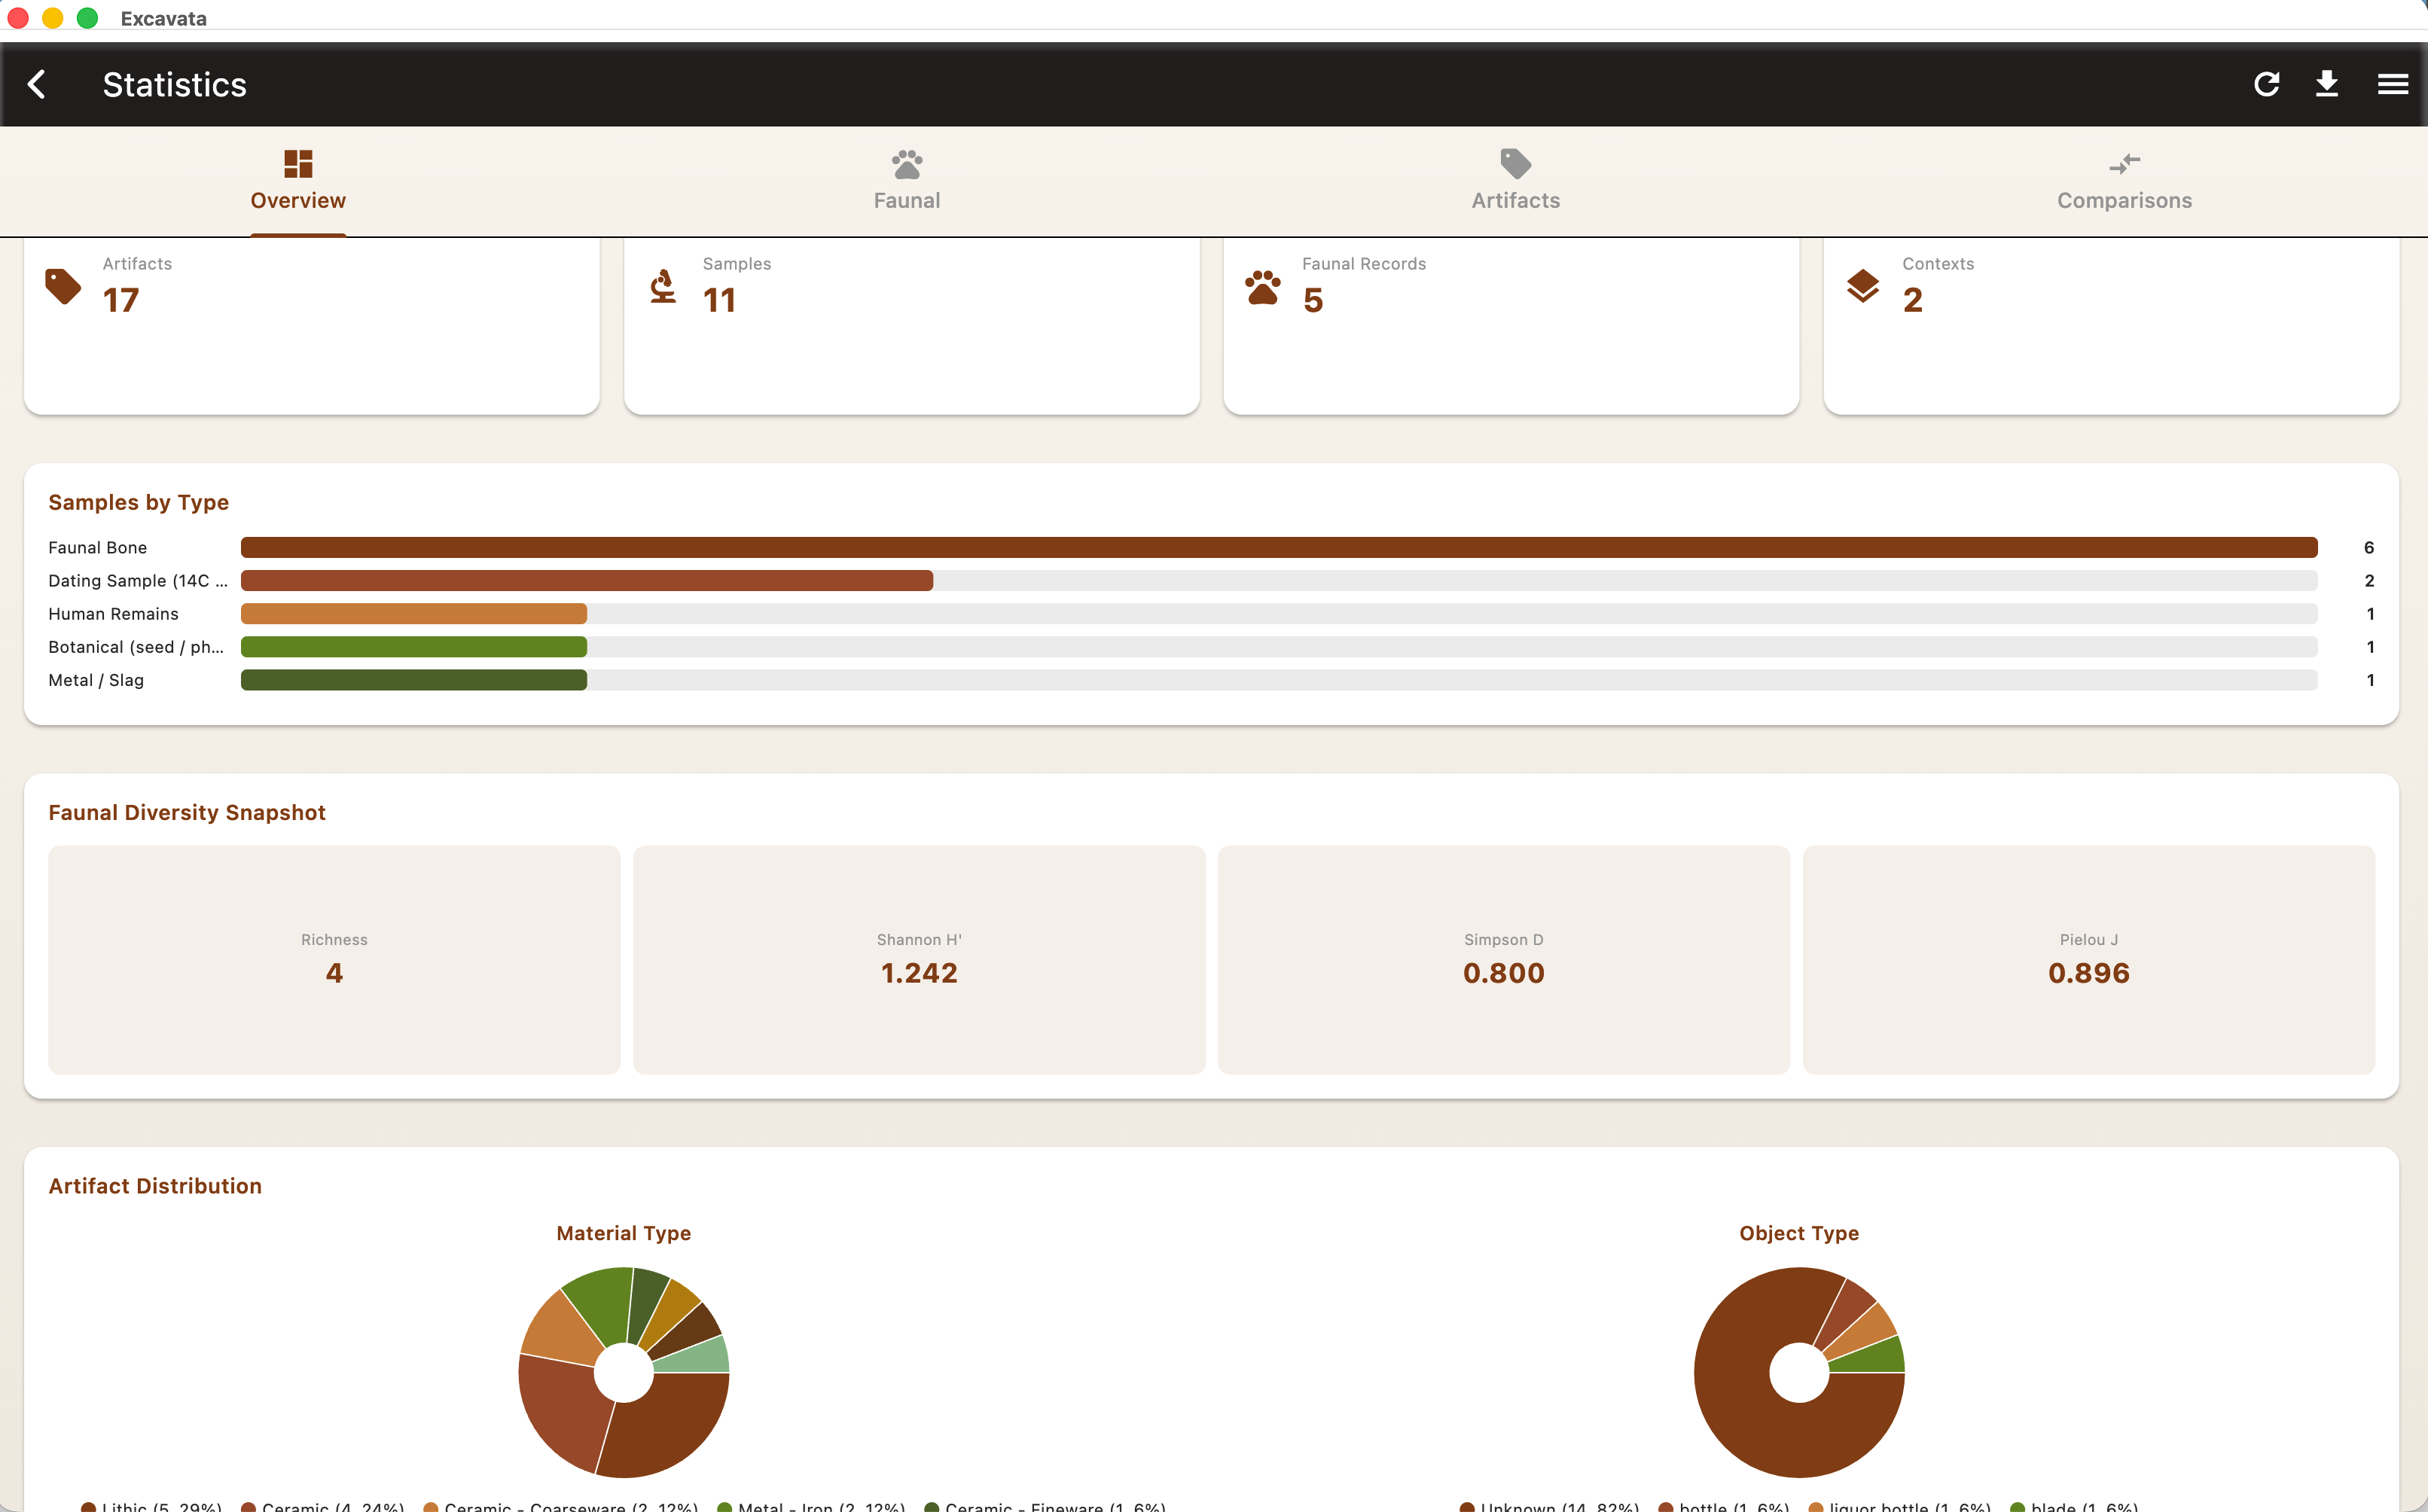
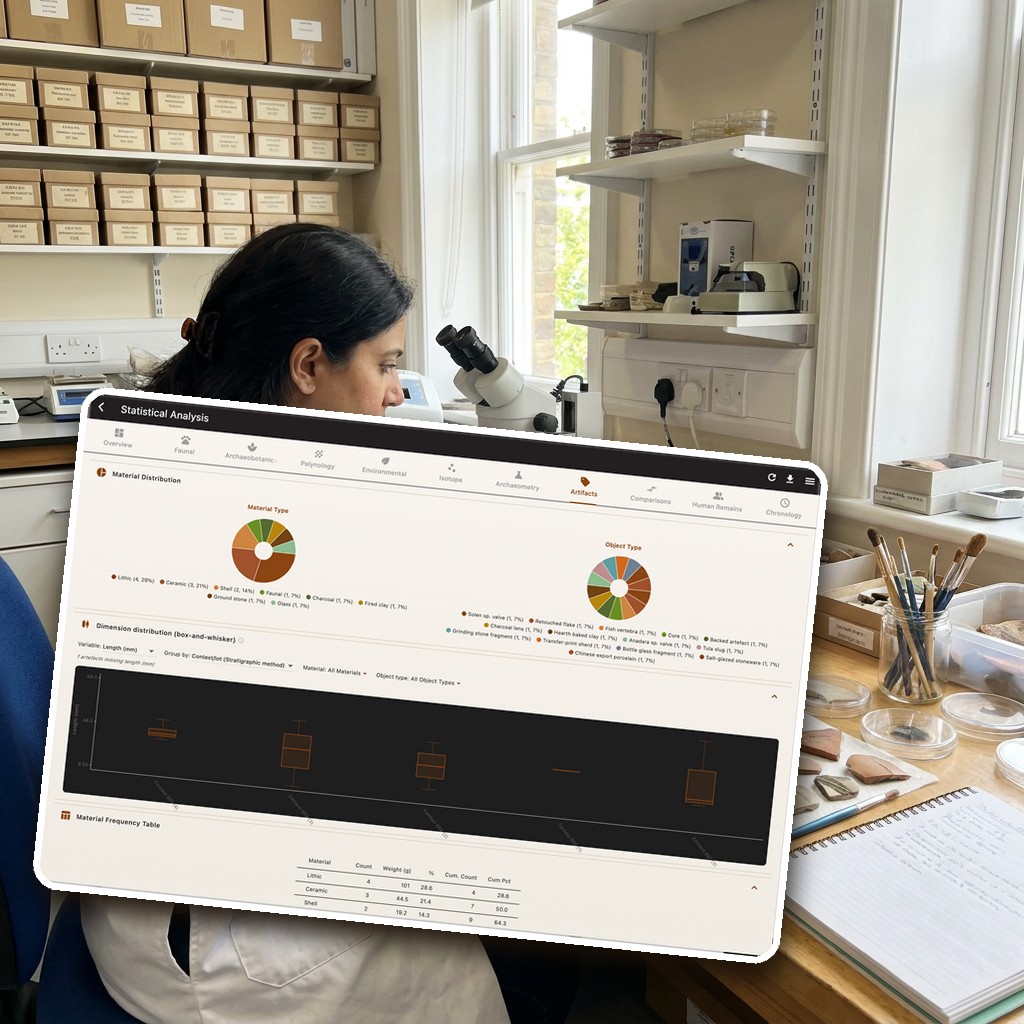
On the desktop, an eleven-tab statistics dashboard turns your finds, samples, contexts and specialist results into quantitative analysis — running directly on your project data, so you can see what you have without a round-trip through a separate statistics package.
The full analytical dashboard runs on macOS and Windows. Several analyses — radiocarbon calibration, osteological estimation, seriation and site comparison — also run in the field on iOS and Android.
What you can analyse
Chronology & radiocarbon
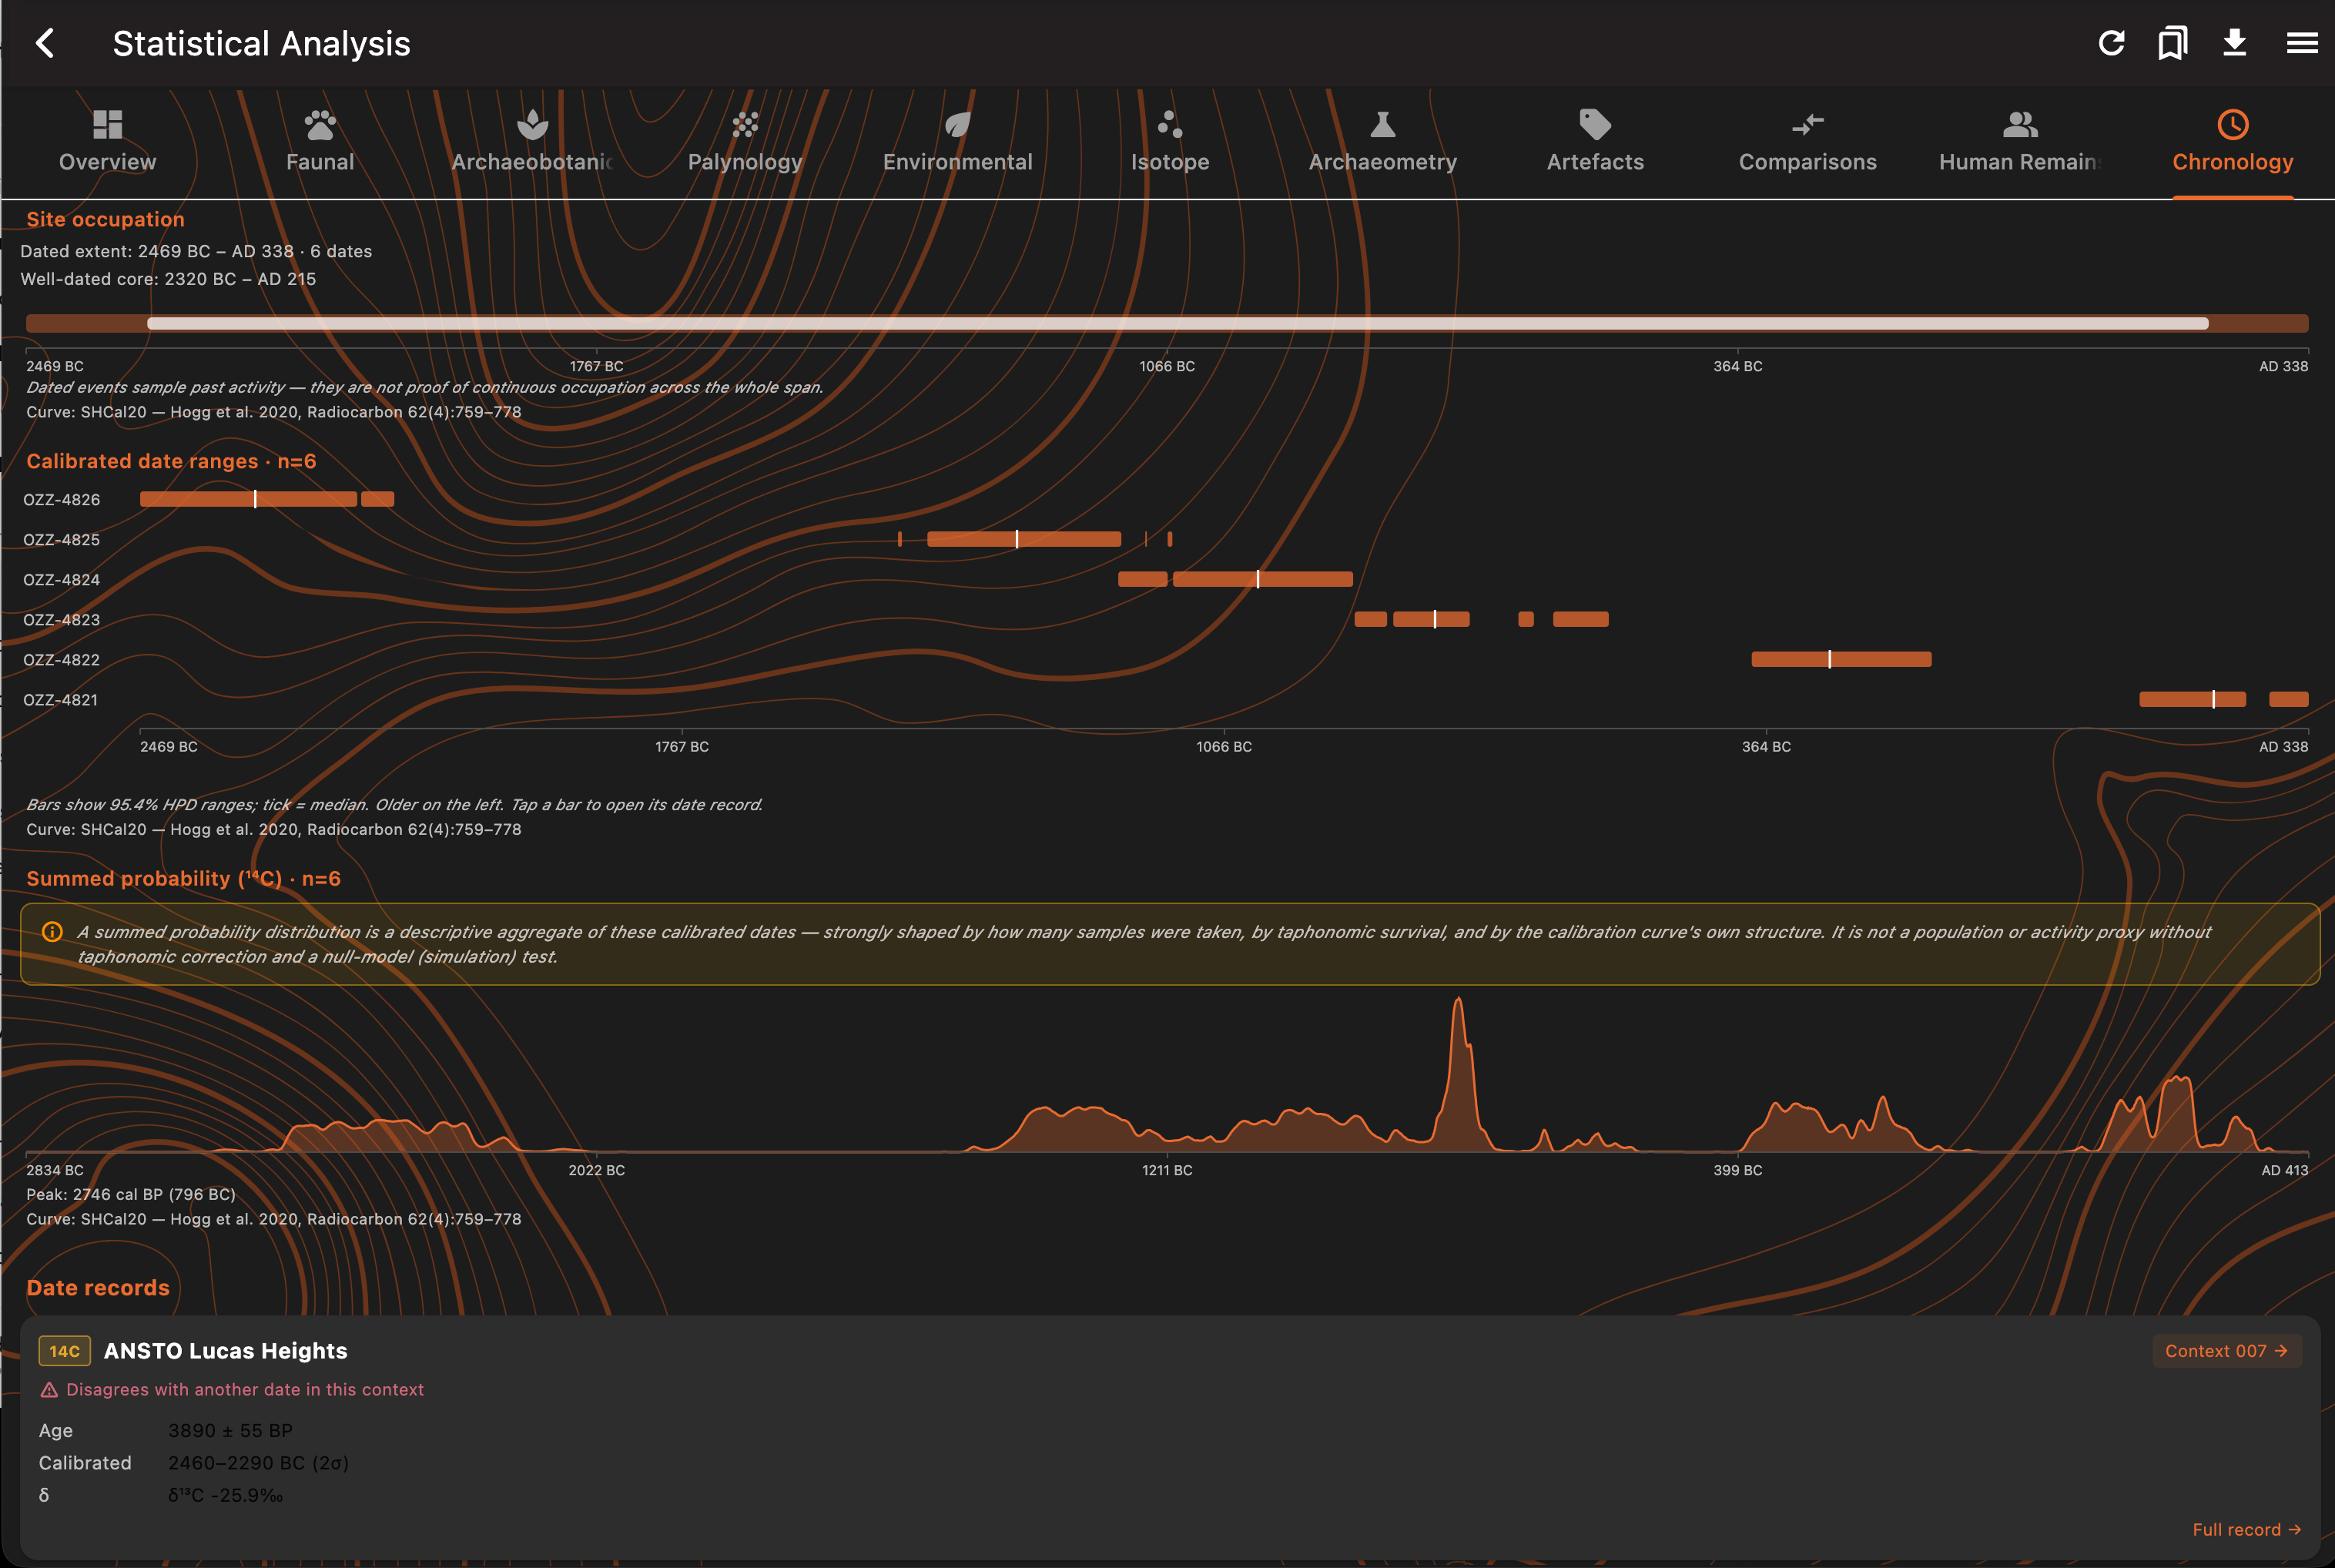
Calibrate radiocarbon dates against the bundled IntCal20, SHCal20 and Marine20 curves — with 68.2% and 95.4% highest-posterior-density ranges — then read them as calibrated date-range multiplots, summed-probability distributions, period phase diagrams, occupation-envelope timelines and date-versus-depth chronostratigraphy. When you need a formal Bayesian model, export a ready-made OxCal (CQL) script, including a version ordered by your Harris matrix. Calibration works on mobile; the summed distributions, age–depth and OxCal export are desktop.
Human osteology & bioarchaeology
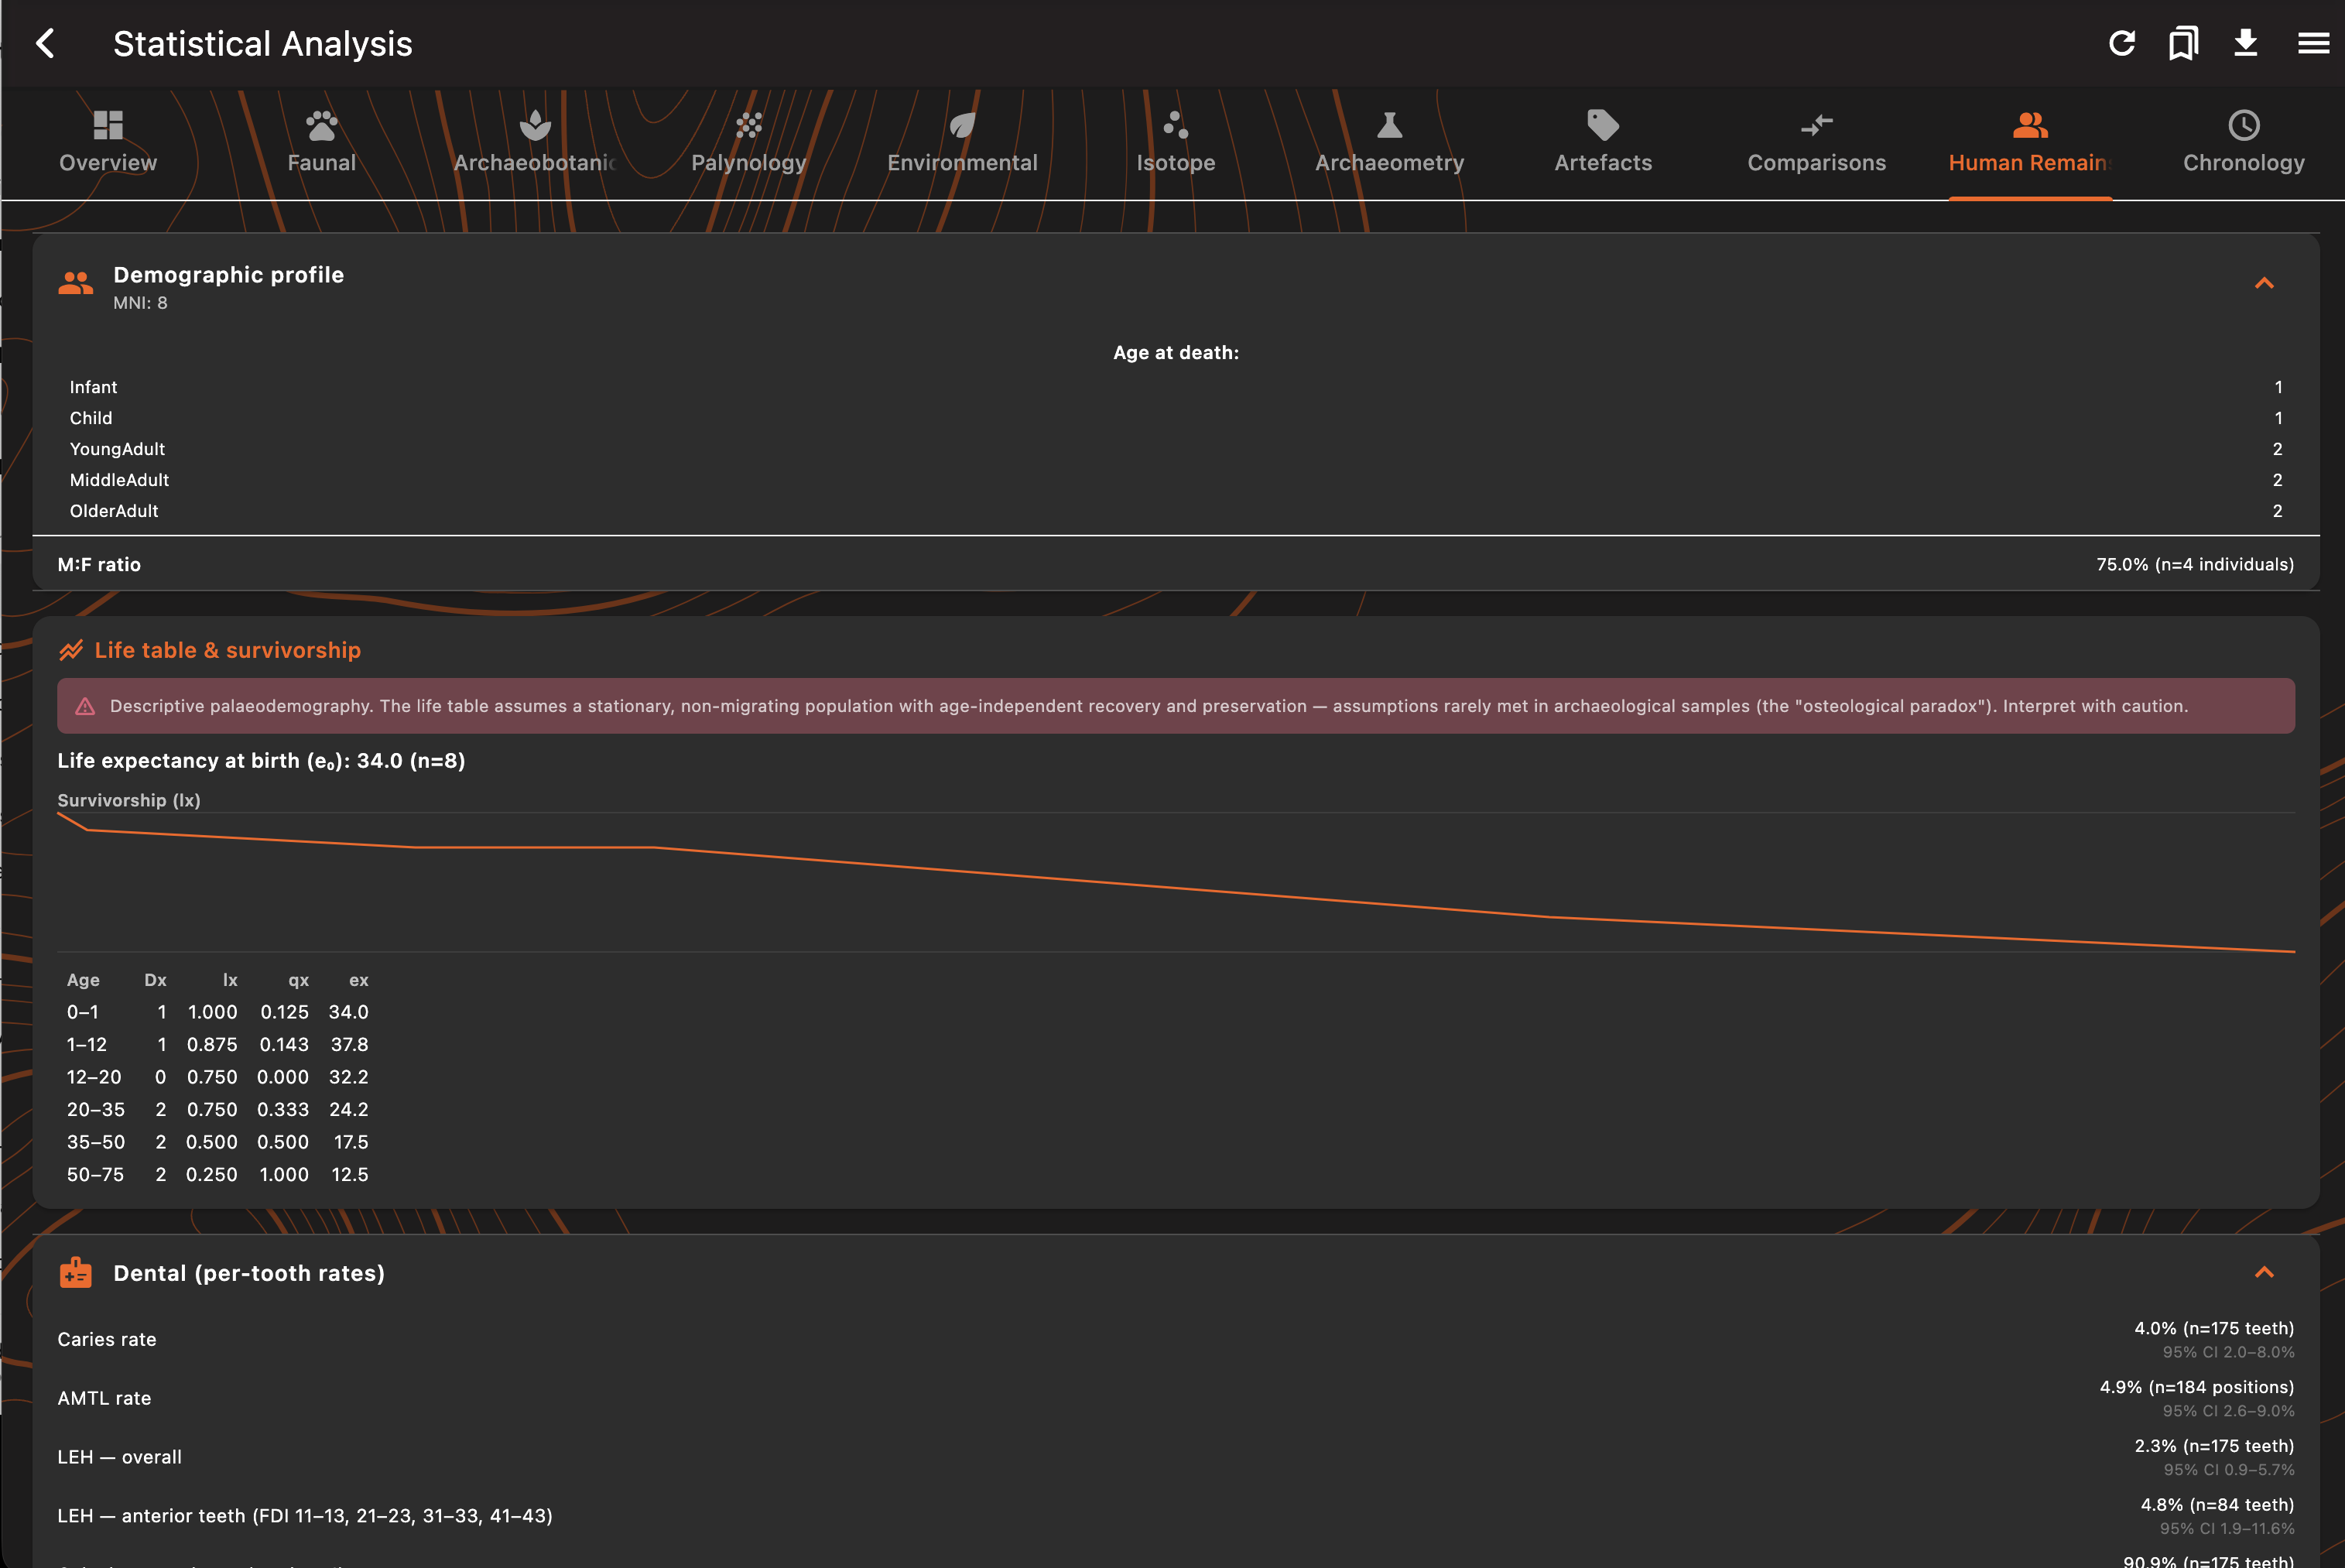
Estimate age, sex and stature from bundled published standards — Trotter & Gleser, Raxter, Spradley & Jantz, Walker, Klales, Phenice, Lovejoy, Meindl–Lovejoy, Lamendin and the London Atlas — right on a tablet beside the remains. On the desktop, go deeper: palaeodemographic life tables, dental and skeletal pathology prevalence with confidence intervals, and a full biodistance suite — cranial Mahalanobis D², non-metric Mean Measure of Divergence and multiple-correspondence analysis, plus bilateral asymmetry and sexual dimorphism.
Compositional & geochemical analysis
Turn pXRF, XRF and ICP readings into grouping and provenance: log-ratio (CLR) compositional PCA biplots for ceramics, mortars and sediments, linear-discriminant classification with cross-validation, rare-earth-element spider diagrams, ternary diagrams, element-correlation heatmaps and XRD mineral-phase ordination.
Isotopes & provenance
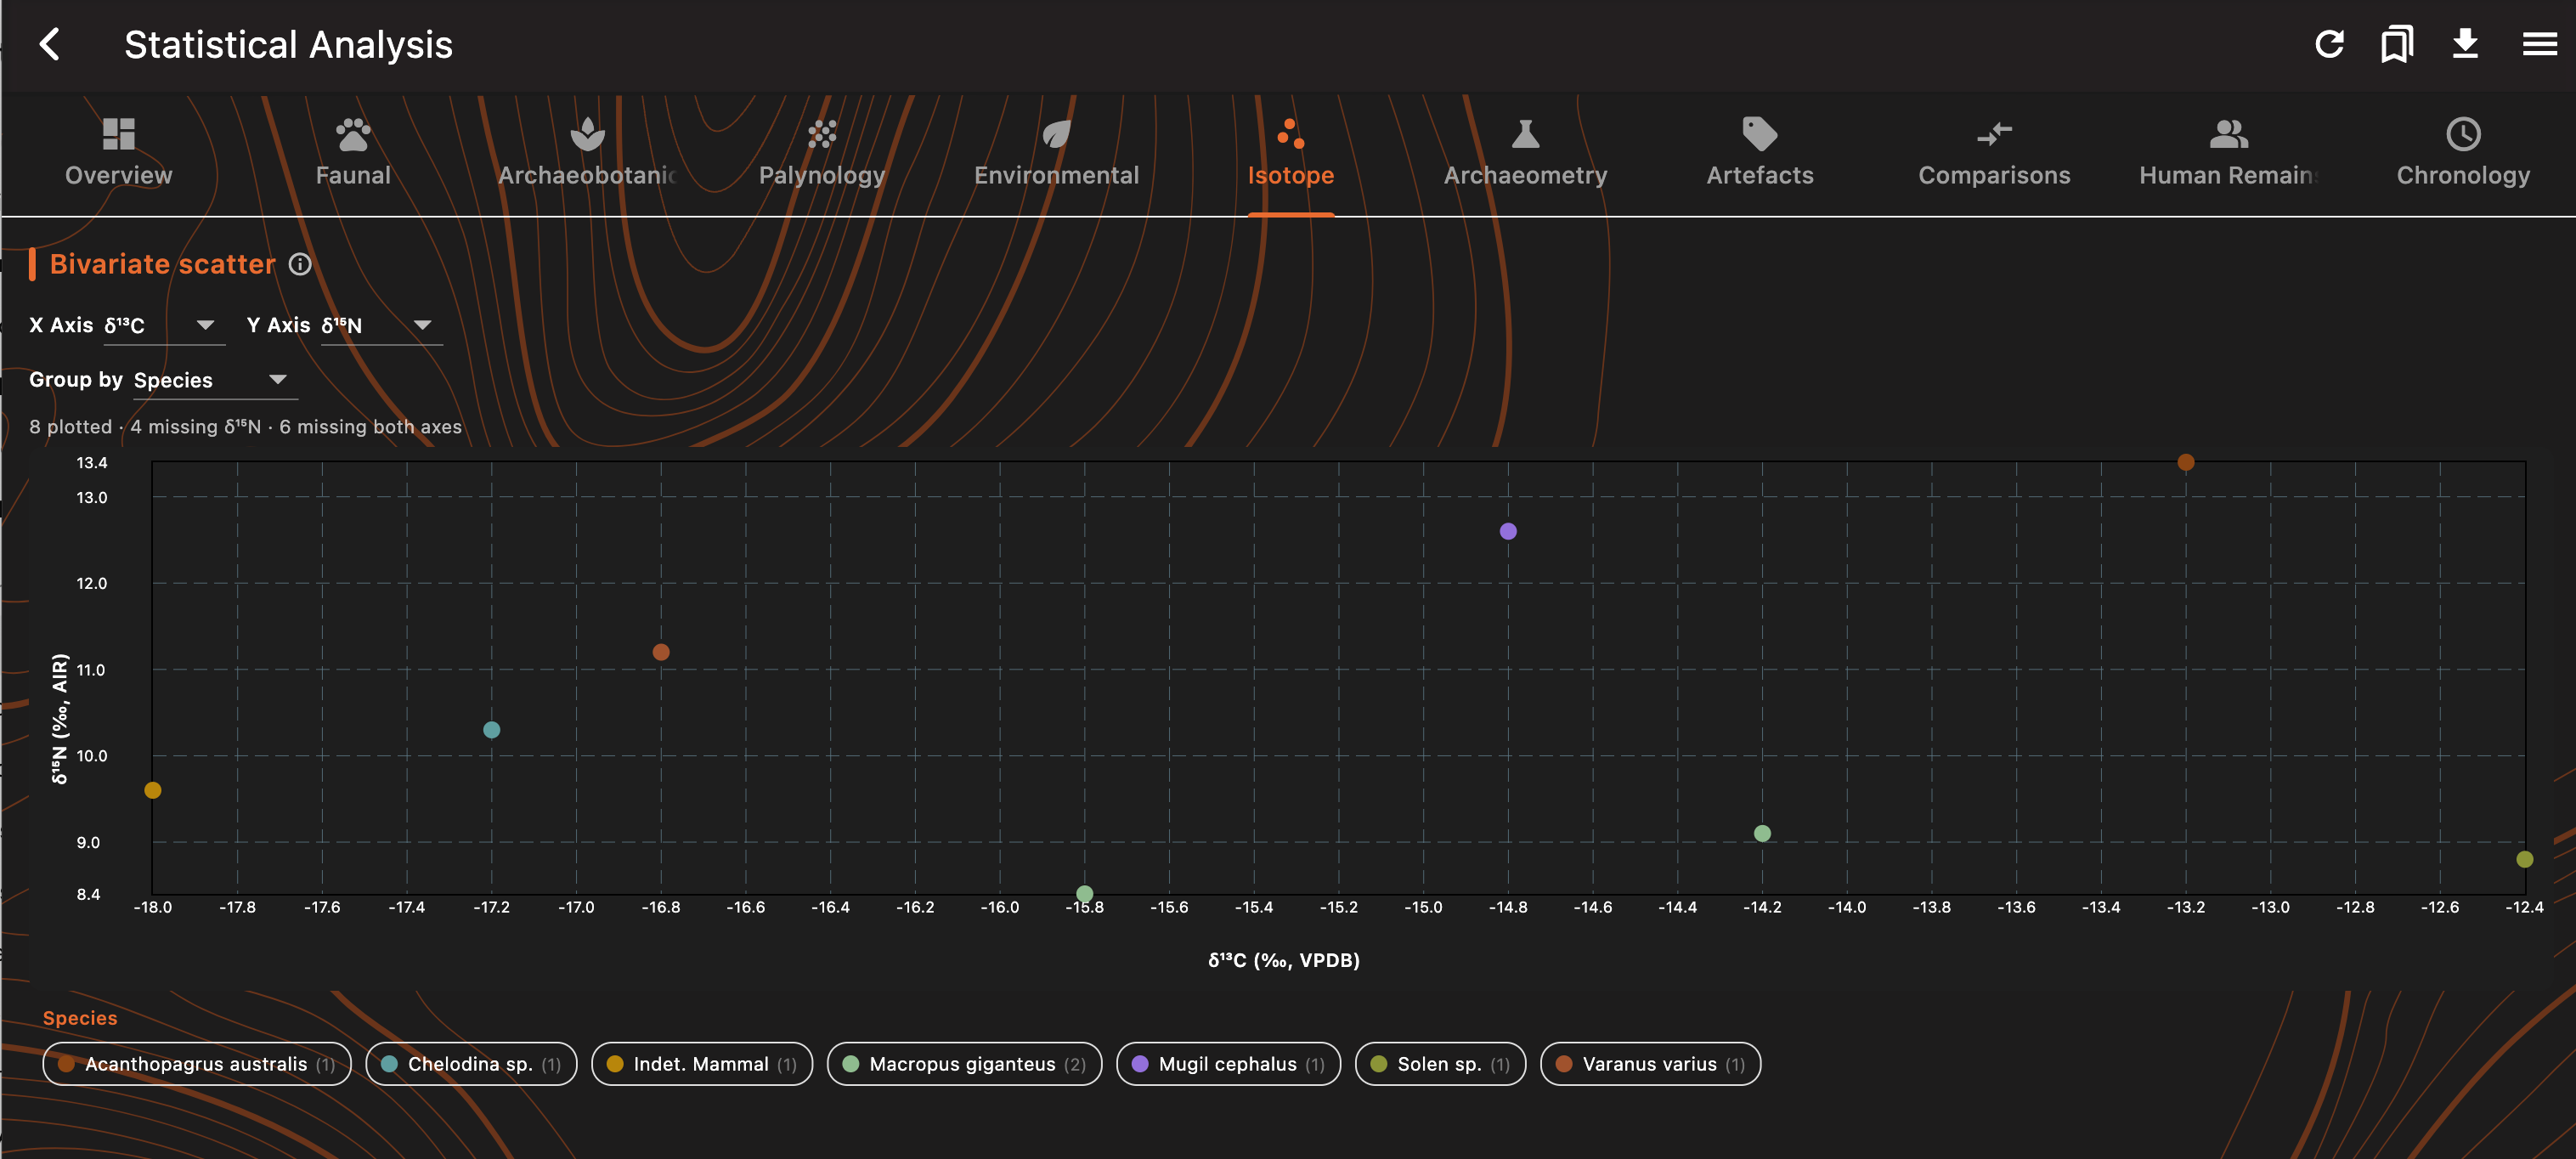
Plot δ¹³C and δ¹⁵N — and δ¹⁸O, δ³⁴S, ⁸⁷Sr/⁸⁶Sr and lead — as bivariate scatters with per-group colouring and convex-hull or 1σ/2σ confidence-ellipse overlays, so palaeodiet and provenance groups separate at a glance, and render interpolated isoscapes on the project map.
Spatial analysis
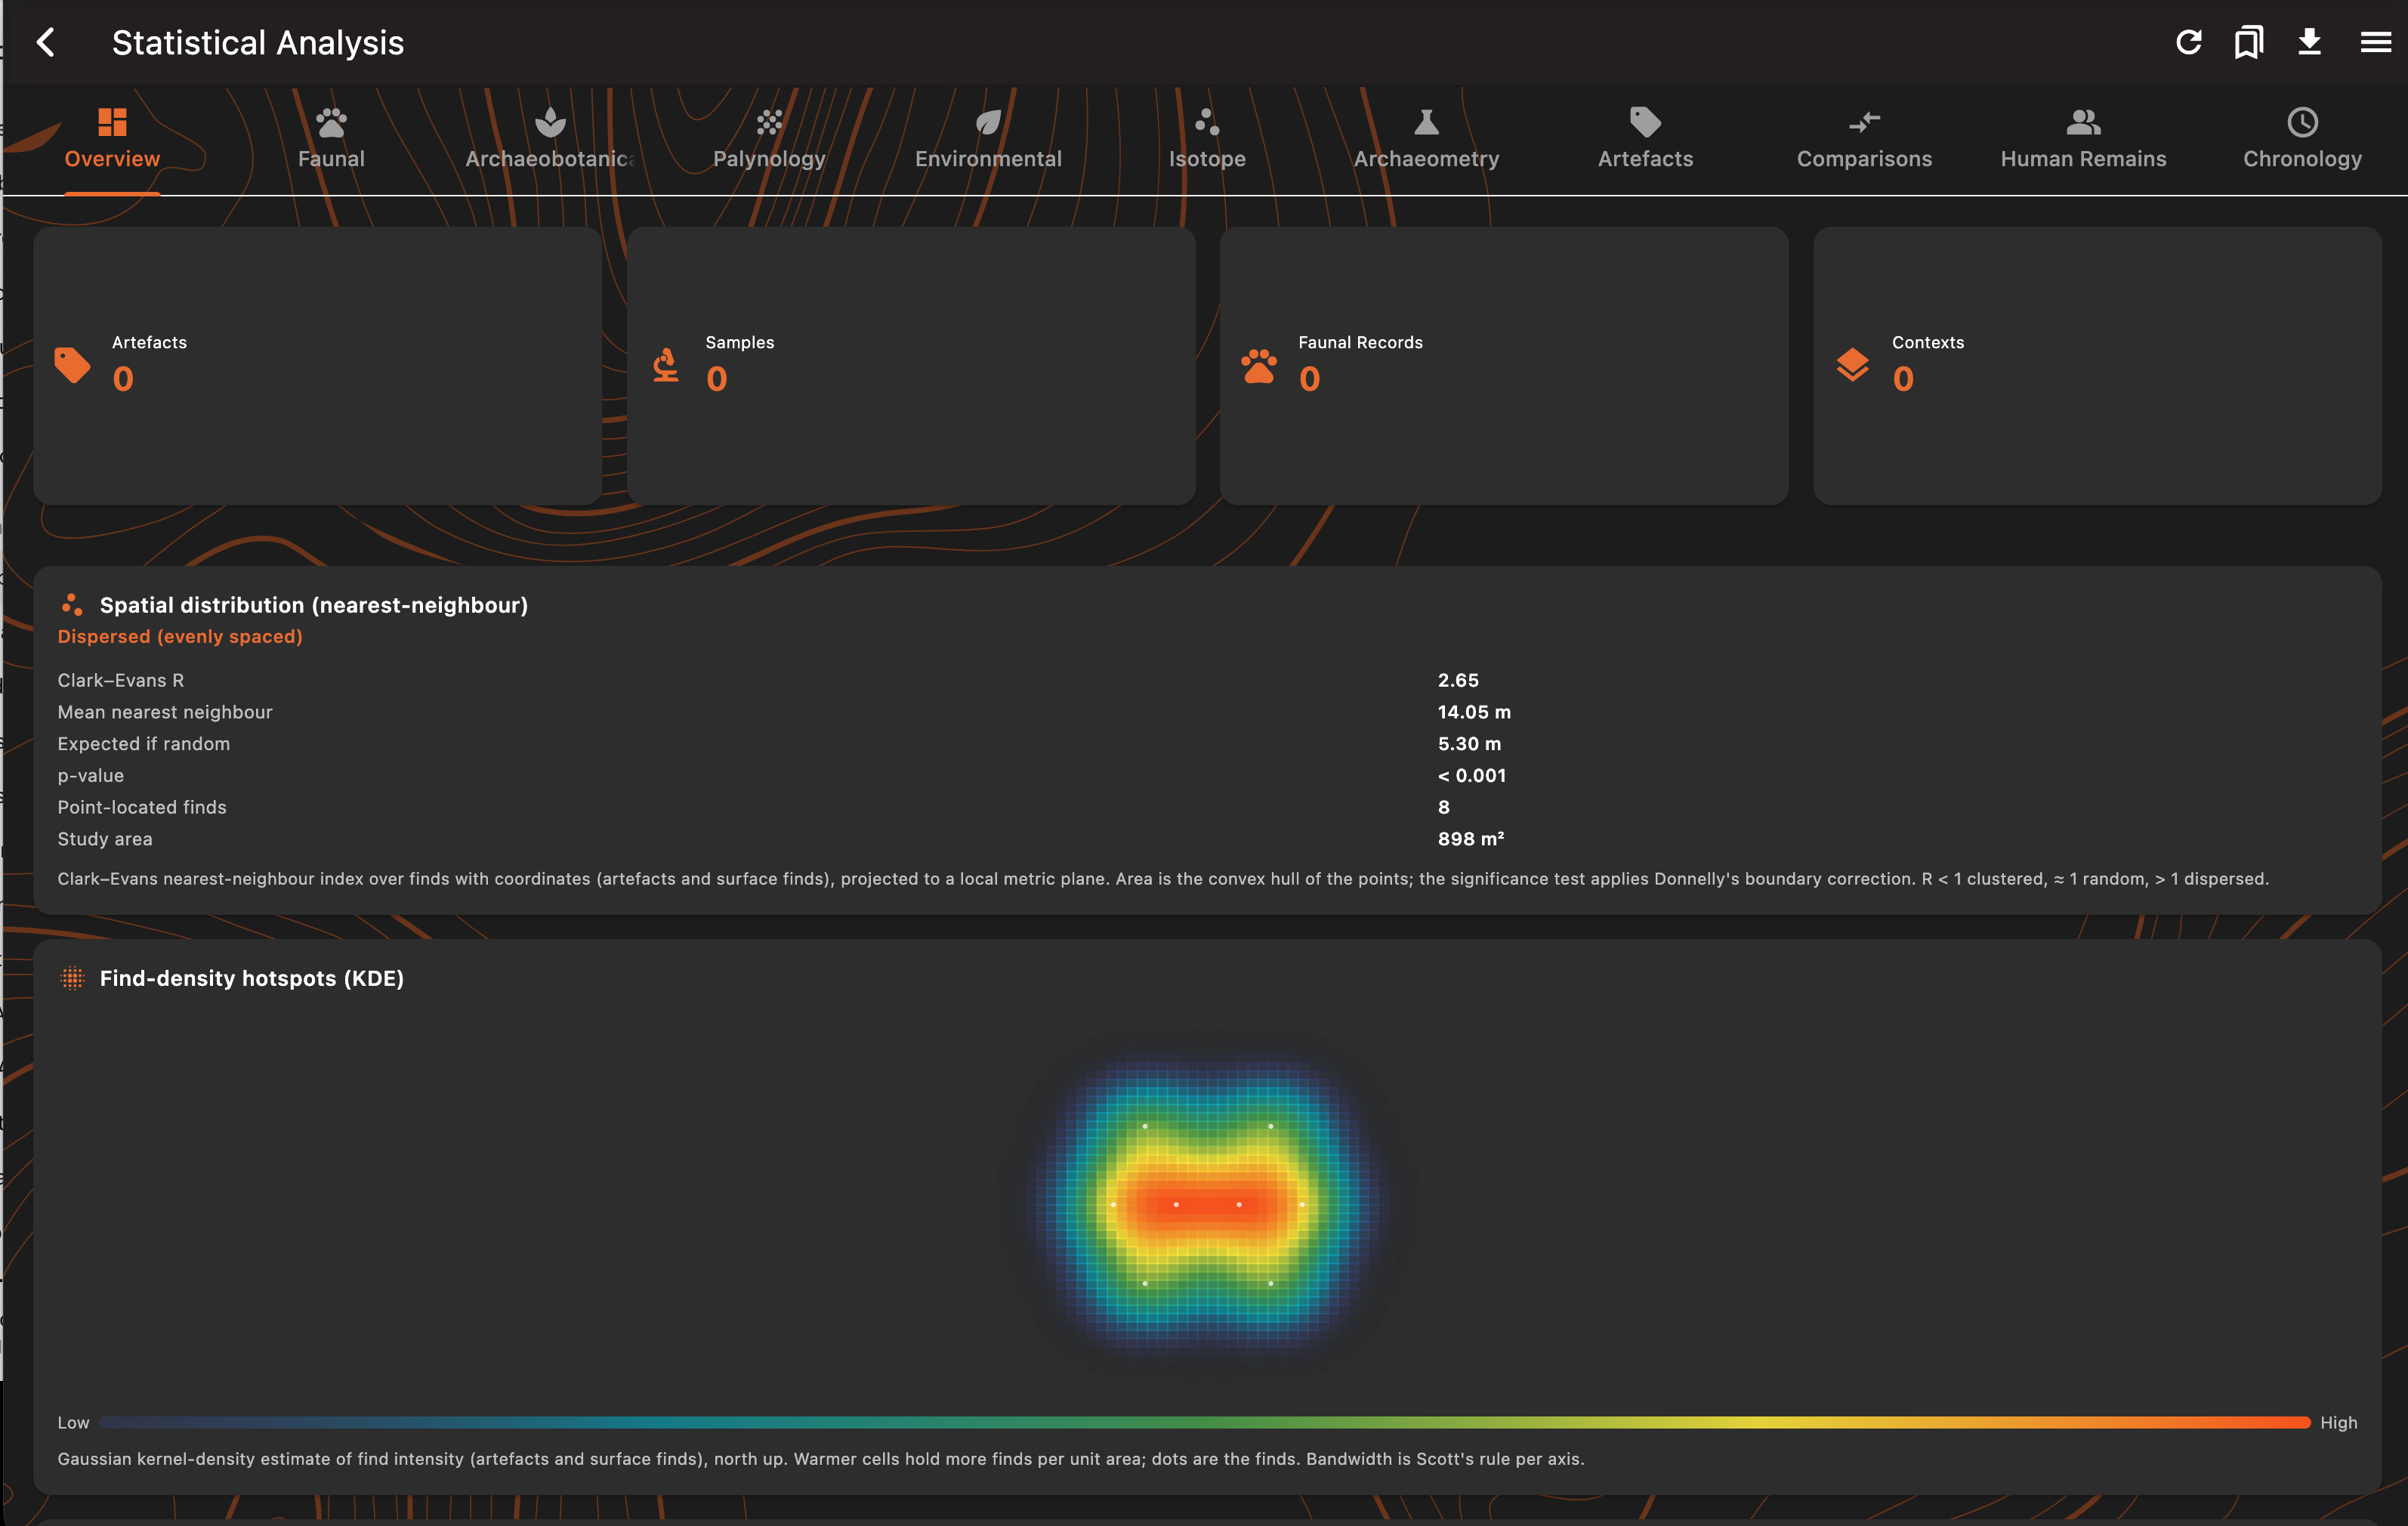
Point-pattern analysis of your finds within a site: Clark–Evans nearest-neighbour, kernel-density hotspots, Ripley's K, DBSCAN and k-means clustering, hierarchical grouping and Moran's I spatial autocorrelation — is that scatter clustered, random or dispersed, and where are the concentrations? These archaeological analyses run directly on your excavation record — they complement a general-purpose GIS rather than replace it, and you can export to GeoPackage or Shapefile whenever you need QGIS or ArcGIS for detailed cartography or geoprocessing.
Assemblages & comparison
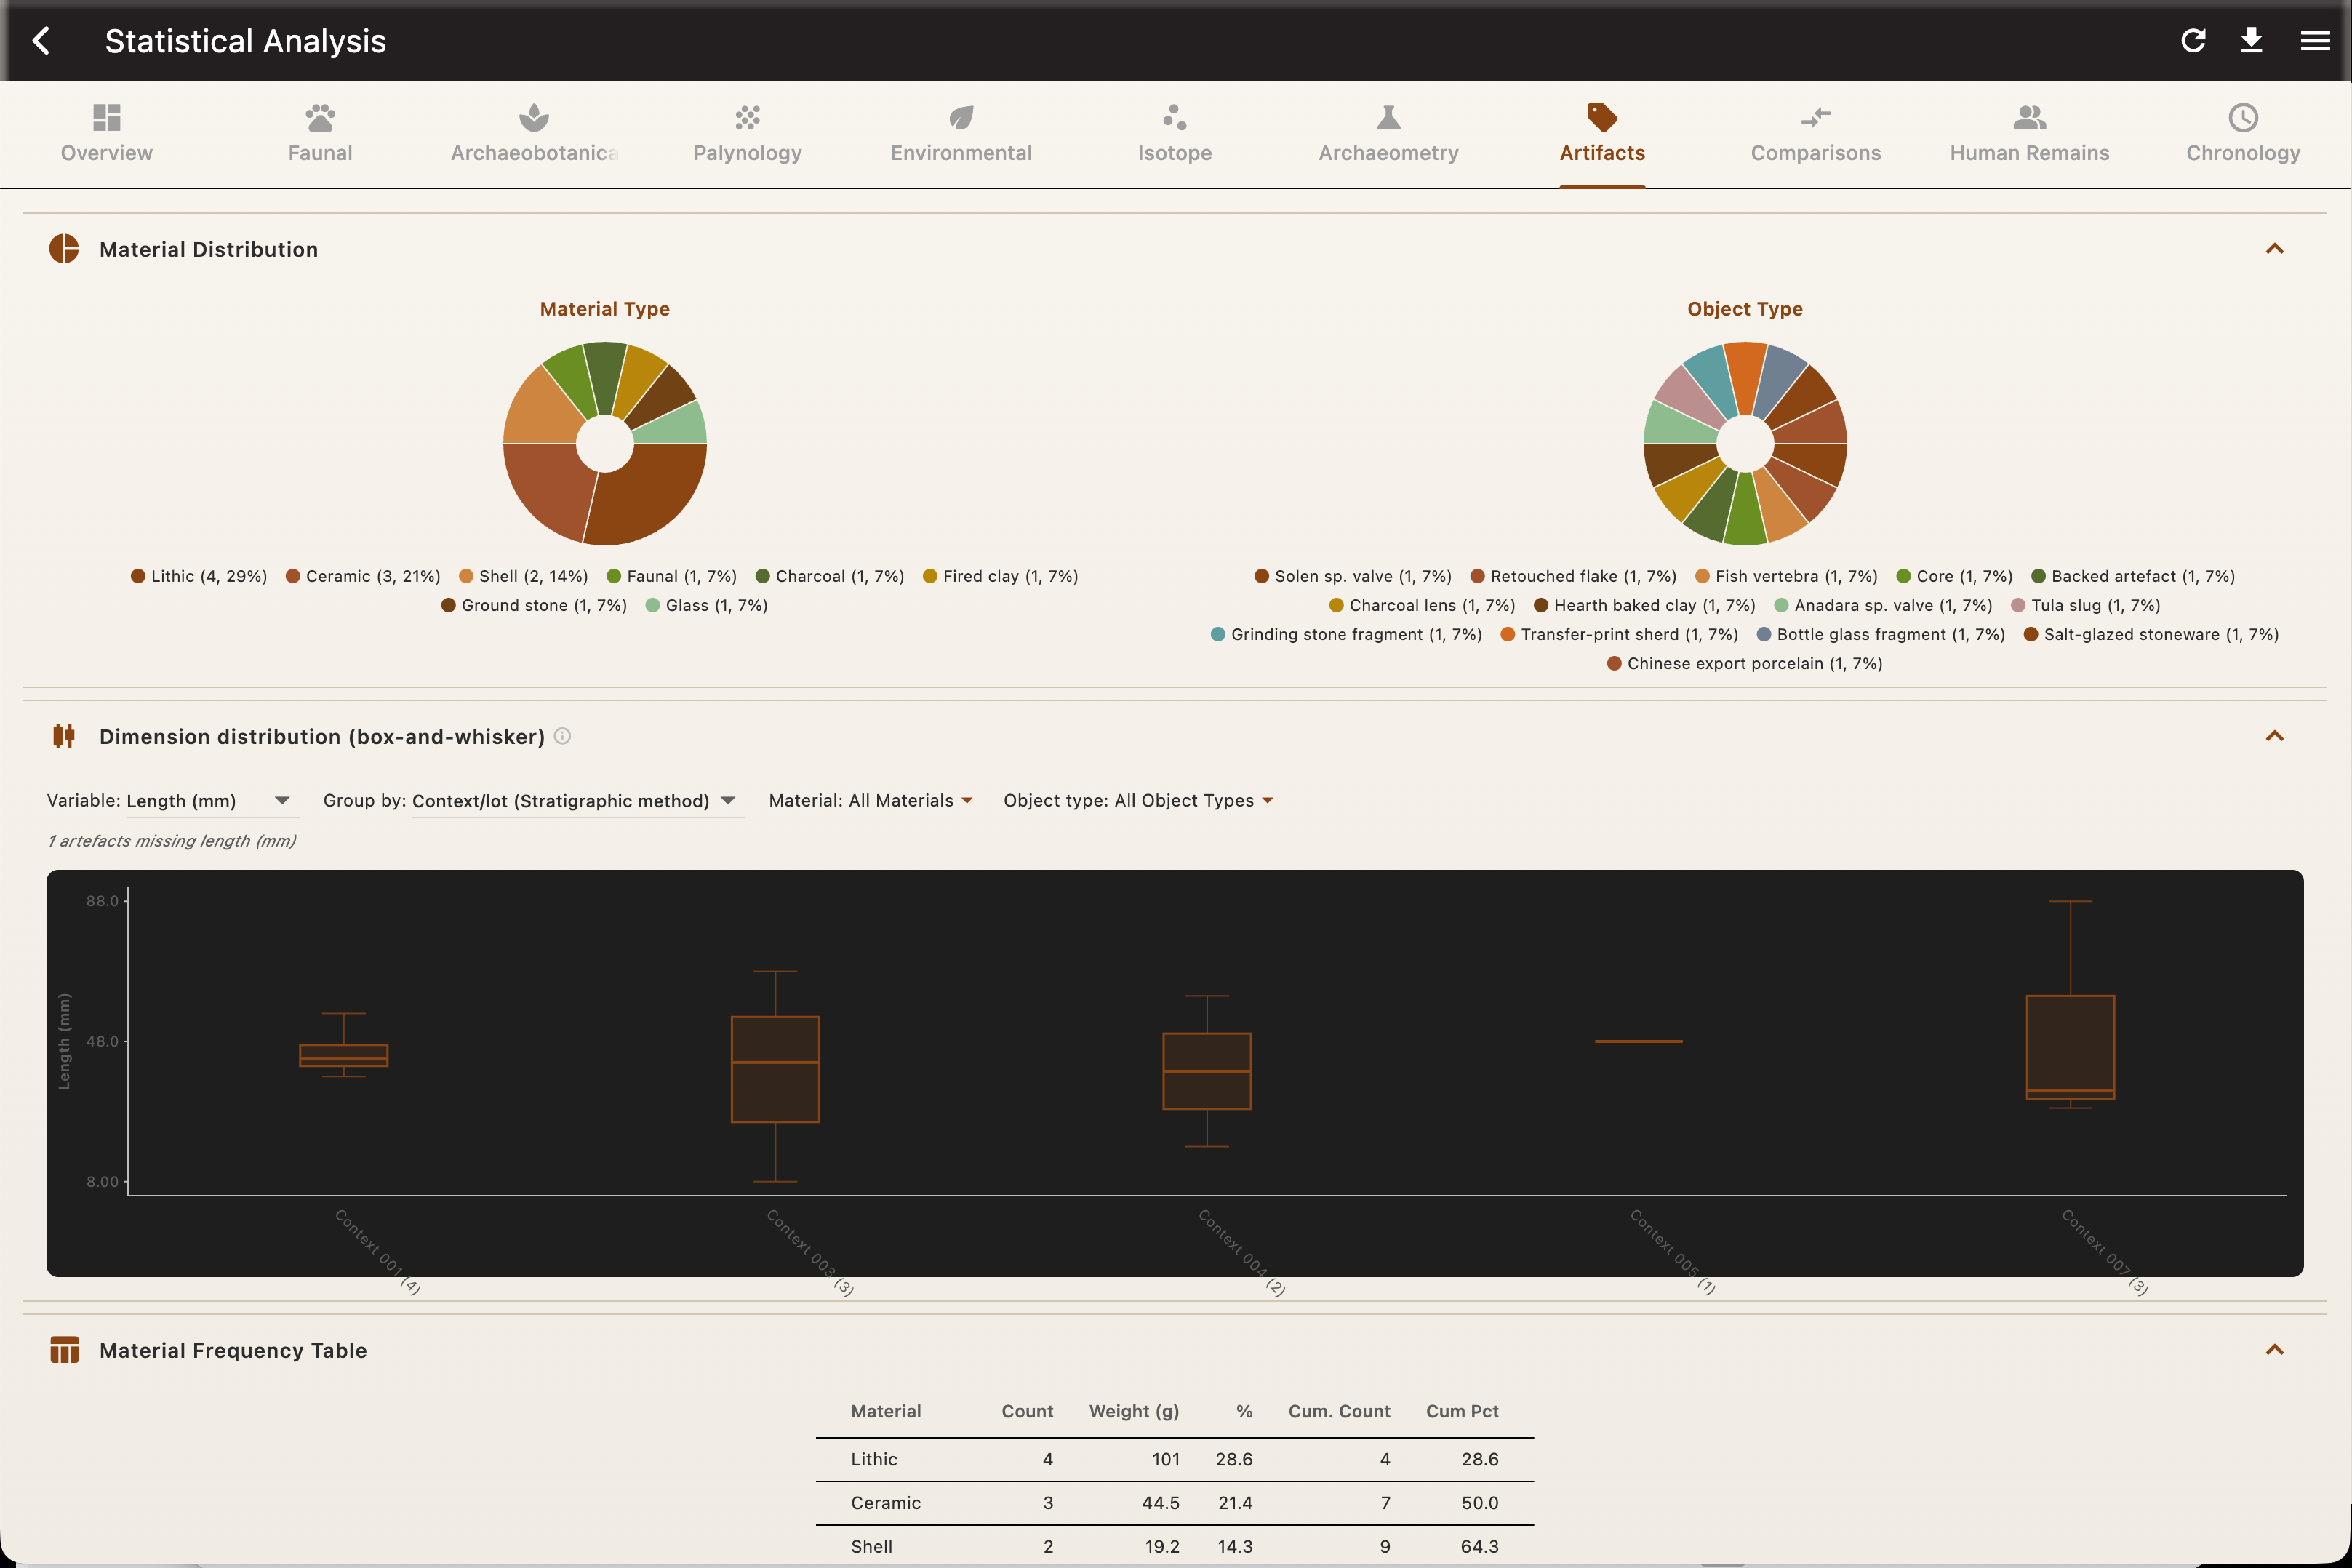
Quantify and compare what you've excavated: NISP, MNI and %MAU, five diversity indices, rarefaction, ubiquity and Payne mortality profiles; chi-square with Cramér's V, Mann–Whitney U, Kruskal–Wallis, correlation and regression; and Brainerd–Robinson similarity with seriation. Compare contexts, phases or whole sites — including against your own reference cohorts.
Reliability & measurement
Research-grade quality control built in: inter-observer ICC, Bland–Altman agreement, technical error of measurement, and Wilson and Clopper–Pearson confidence intervals throughout — so a figure arrives with its uncertainty, not on its own.
Analysis that travels to the trench
Not everything waits for the lab. On a phone or tablet you can already:
- Calibrate radiocarbon dates (68.2% / 95.4% HPD against IntCal20, SHCal20 and Marine20).
- Estimate age, sex and stature from bundled osteological standards.
- Seriate and compare assemblages, and compare a site against reference cohorts.
- Generate a statistical report to drop into a summary.
Results you can cite, not throwaway charts
Key analyses can be saved with their inputs and a short methods statement, re-run against your current data, and drift-checked — the citable, reportable version of a result. A Statistical Report gathers assemblage counts, context inventories and per-material totals, ready to paste into a report appendix, on phone or desktop.
Methods, in full
A sample of what's implemented and tested — evidence of depth, not a checklist to memorise:
Built for the desk as much as the trench
The full analytical environment lives in Excavata for macOS and Windows, working on the very same project you recorded in the field.
Explore the desktop app